by admin | May 28, 2014 | Blog, Infographic |
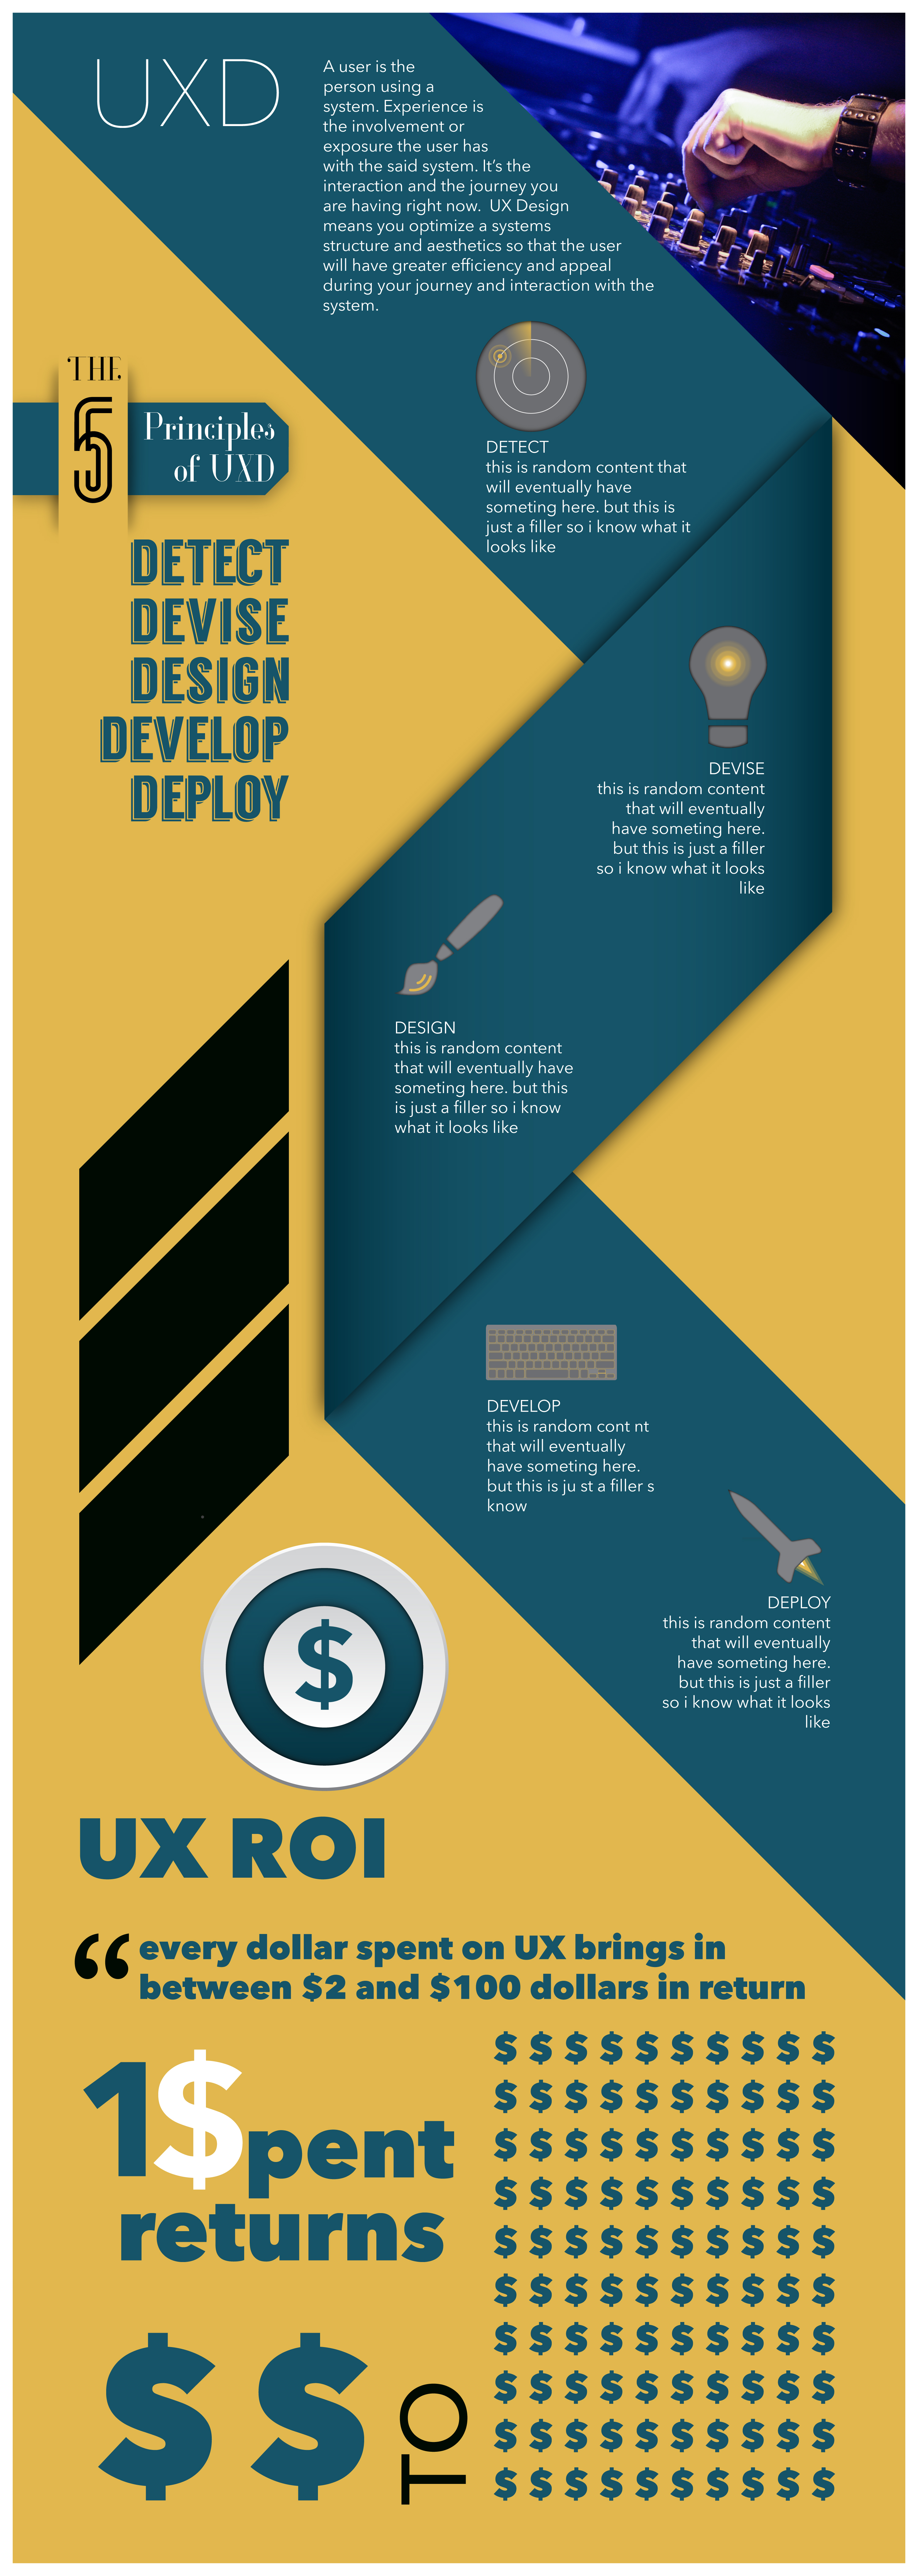
Summary This is the final composition of our work. Our objective was to create an infographic based on a topic we are interested in. It would have to have at least one type of chart in it and at least three vector graphics. The topic I chose was the general process of...

by admin | May 24, 2014 | Infographic |
Summary For this stage of the project, we are to refine our infographic with improved vectorized graphics and create a stylized graph or chart. I wanted to keep the graphics to compliment and be consistent with one another. So I used a philosophy of icons, but...

by admin | May 17, 2014 | Infographic |
Summary So I wanted to create a timeline layout of an infographic set up in a way that is related to a folded ribbon of sorts. Its basically going to have 5 sections of what UXD is and the top being a introduction of it. Icons and and graphics will be put in...

by admin | May 10, 2014 | Infographic |
Topic User Experience Design Process Category infographic topic falls under How-To/Timeline Why I chose this topic and category I decided to go this route because my career path is headed toward user experience design. A brief idea about what type of information...


