Summary
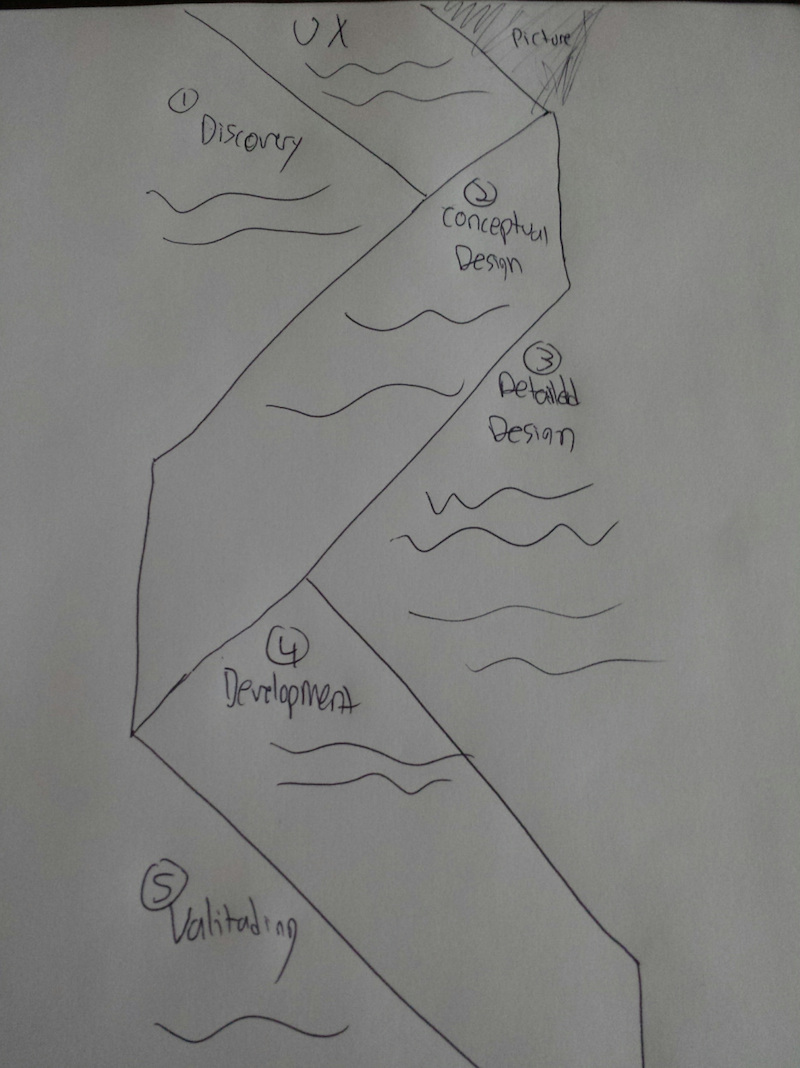
This is the final composition of our work. Our objective was to create an infographic based on a topic we are interested in. It would have to have at least one type of chart in it and at least three vector graphics. The topic I chose was the general process of user experience design, UXD. I chose this because this is a field I am interested in going into, and therefore I wanted to learn a little more about it.
As to problems, I have found that I can’t use very thin text when this file is a jpg. The way I solved this was going through the text again, and making them a regular thickness. It has less heirarchy, but the original is in a pdf, and I think that one is splendid. The program I used was adobe illustrator, because I know how to navigate it pretty easily. I created all the icons, except for the computer and the keyboard.Of which I found manipulated them by cutting out stuff I didn’t want, and altering the color. I also used all the photos from a site called picjumbo, which provides free images.
http://www.pinterest.com/pin/241435229998524116/


